THE PACIFIC IS CHANGING
Future of
Paradise
Five islands. One changing climate.
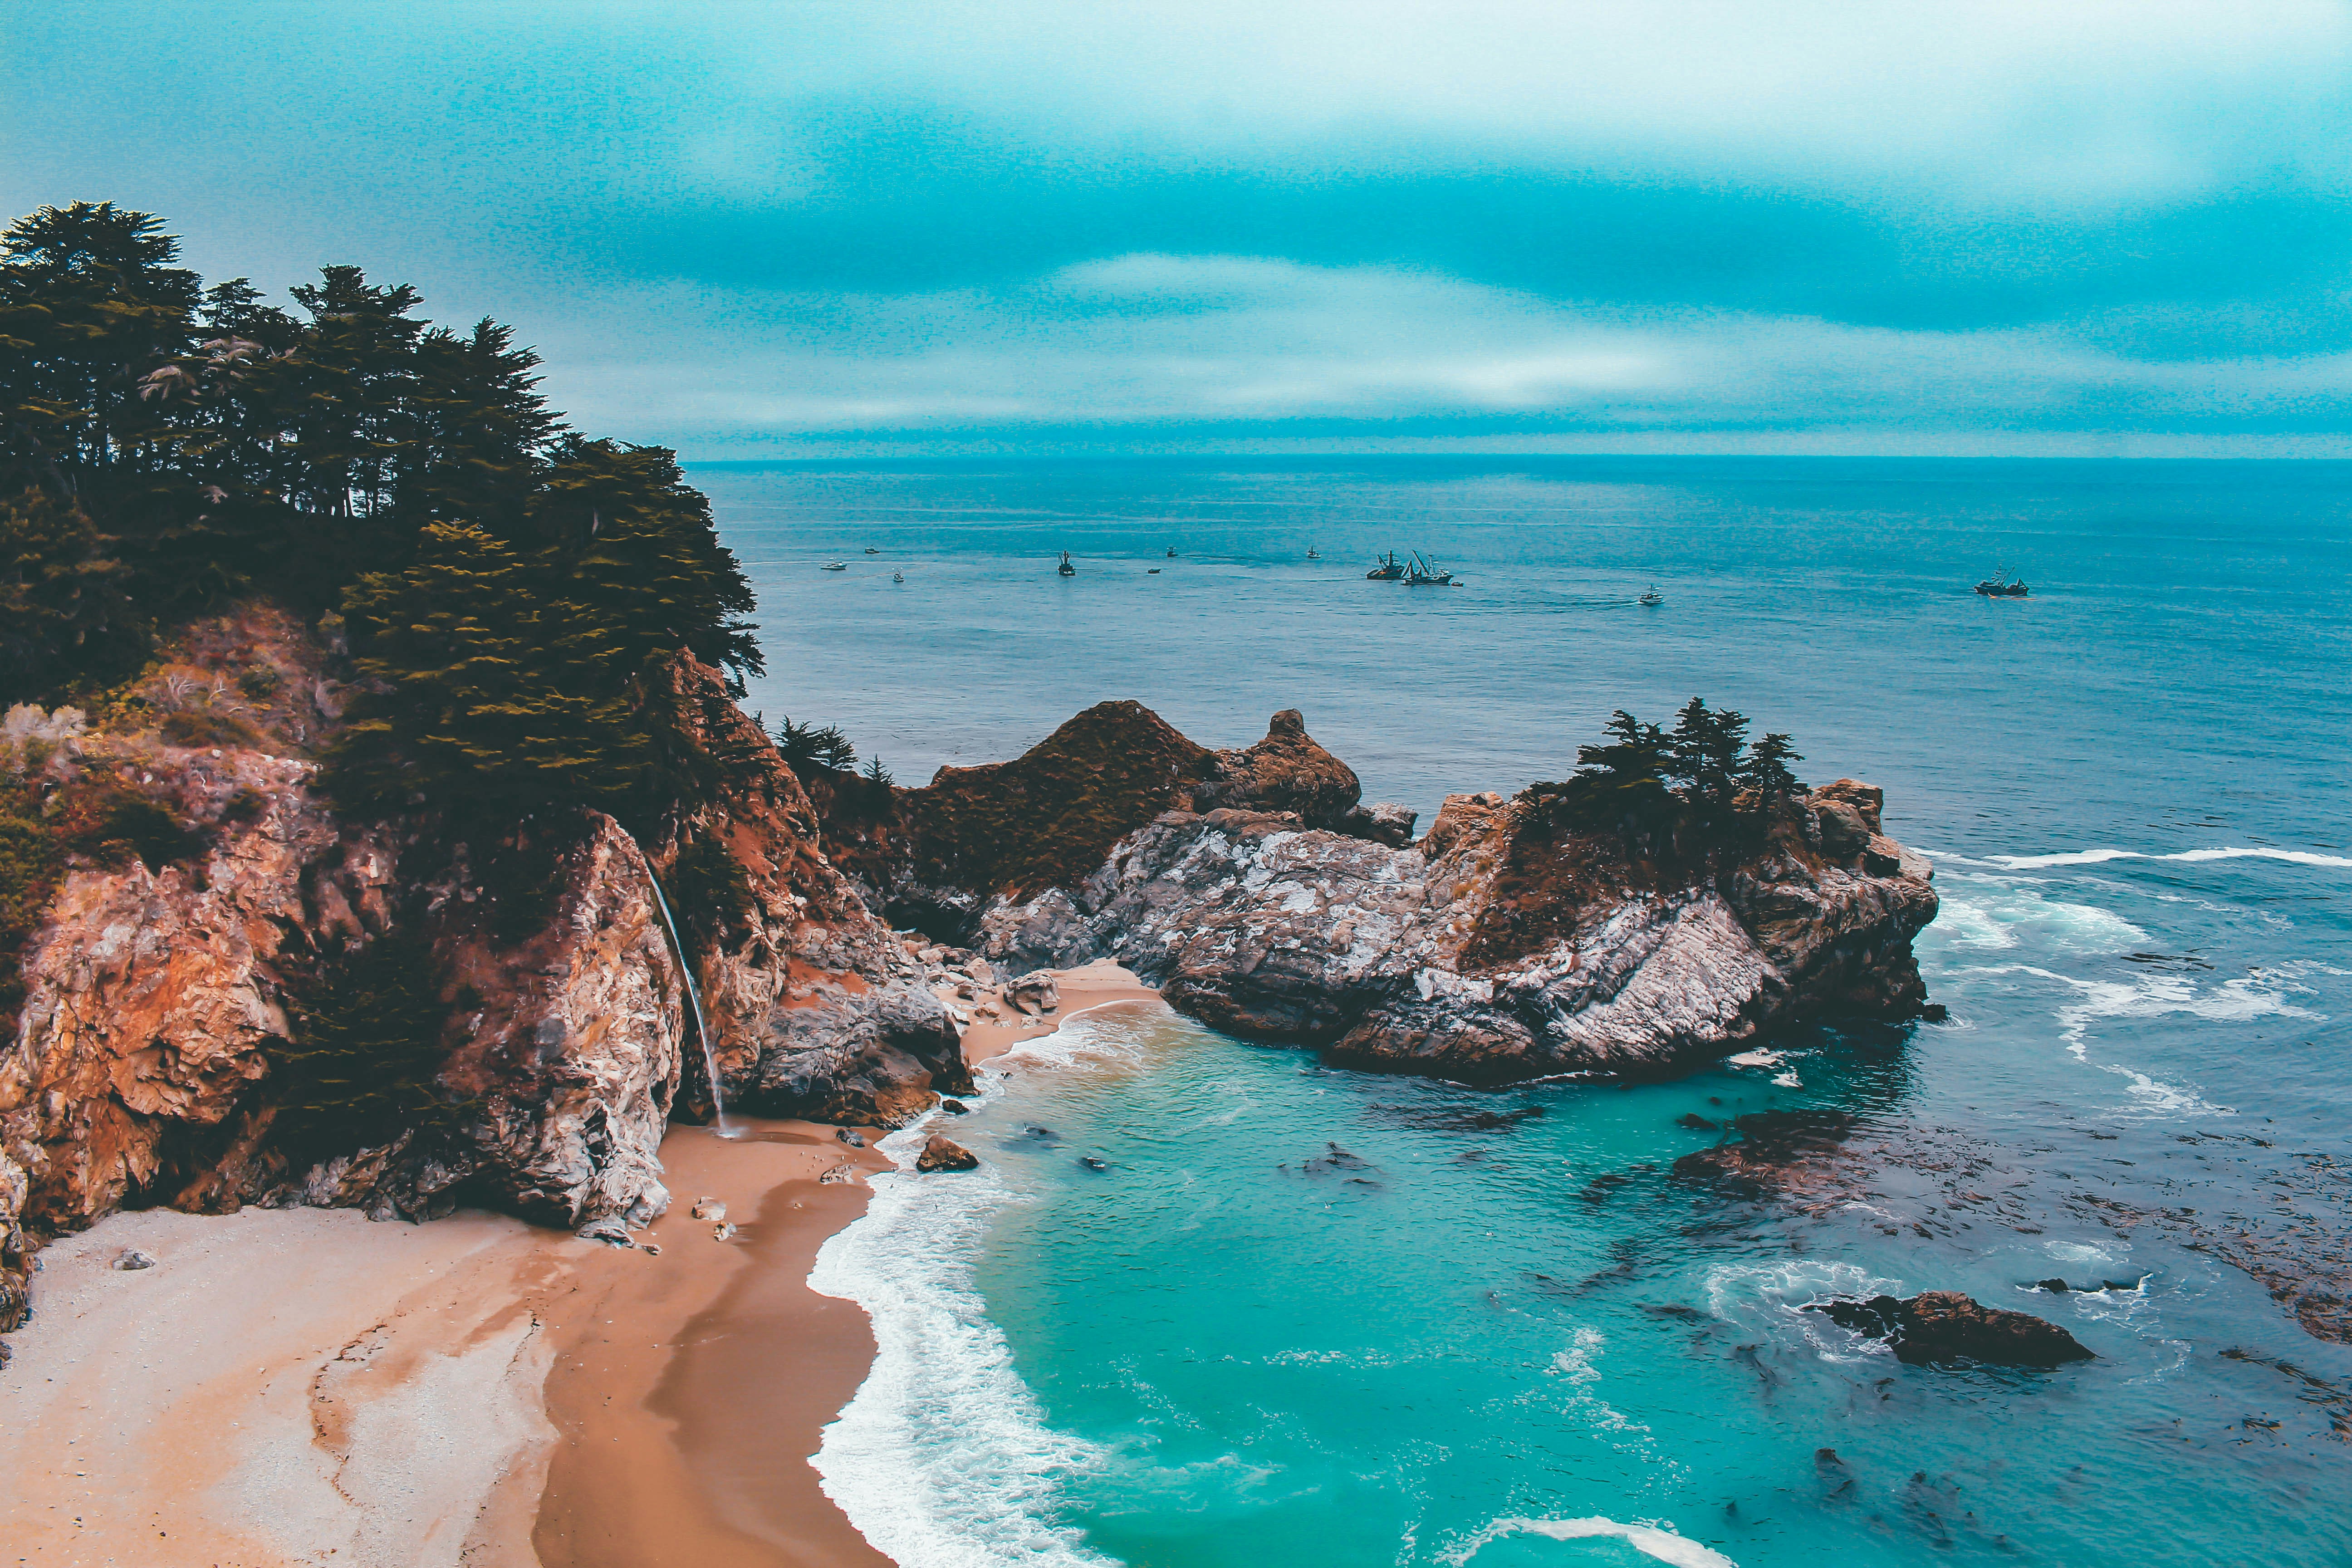
Photo by Joe Caione on Unsplash
Scroll to explore
↓
THE PACIFIC IS CHANGING
Five islands. One changing climate.
MEET THE ISLANDS
01
02
03
04
05
Different islands . Different vulnerabilities
One interconnected future
Climate change is no longer a story about the future. It is already being recorded in the ocean.
Sea-level anomalies show how observed sea levels differ from a reference level over time across the five islands.
As can be seen from the chart, the trajectories are not identical. Some years bring larger departures from the baseline, while the longer-term movement reveals a changing ocean around these island nations.
For low-lying nations like Tuvalu and Kiribati, where the highest point
of land can sit just a few meters above the waterline, even a small
upward shift is not cosmetic. It's existential.
The first signal of a changing paradise is beneath the surface.
But the ocean isn't the only thing warming...
An anomaly represents the difference from the dataset's reference level; it should not be interpreted as absolute sea-level height.
The ocean tells only part of the story.
Surface temperature anomalies show how temperatures have shifted relative to a historical baseline.
Year-to-year variability is expected. What matters is the broader pattern: the baseline itself is moving.
Across five Pacific nations, surface temperatures have shifted measurably since 1990 — not a single hot year, but a sustained climb.
For islands surrounded by ocean and dependent on climate-sensitive ecosystems, sustained warming can place additional pressure on the systems that support everyday life.
And rainfall is another signal that is moving in a messier way. Rainfall anomalies show how much wetter or drier each year was compared to the historical baseline, for each island.
The volatility that can be seen in the data, in itself is the risk. Agriculture, freshwater supply and infrastructure are built around expected rainfall patterns. When the swings get wider, "normal" becomes harder to plan around.
Climate risk isn't only about averages — it is also about extremes and uncertainty.
Rainfall anomaly reflects deviation from each island's own historical baseline — a wide swing does not necessarily mean more total rainfall, only more year-to-year unpredictability.
For islands surrounded by ocean, the coastline is more than scenery. It is where homes, roads, communities, infrastructure and livelihoods meet the sea.
Using satellite-derived shoreline data, each island's coast can be measured for how much it has physically moved — and how much of it is retreating rather than holding steady.
The shoreline data shows that these islands are not experiencing the same coastal change. Kiribati records a strongly negative median shoreline movement and Vanuatu shows a smaller negative median, indicating erosion, while other islands show net shoreline movement in the opposite direction.
But a single island-wide number can hide an important detail: coastlines do not move uniformly. Some stretches can erode while others remain stable or even build outward.
That is why the share of coastline experiencing erosion matters alongside the median rate. Together, these measures tell us not just how fast the shoreline is moving, but how widespread the pressure is.
The question is no longer whether the coast is changing — but how much of it is changing, and where.
Climate risk isn't just physical — it's about who's in the way of it, and whether that number is growing.
Climate signals become human stories when they intersect with people.
Vanuatu's population is growing fastest among the five, at 2.28% annually — meaning more people will be living with these risks in the decades ahead, not fewer.
Population growth changes the scale of potential exposure — more people, homes, infrastructure and essential services may occupy the same limited island space.
But growth is not inherently a vulnerability. It is the context in which climate pressures have to be managed.
The Pacific's islands are more than places to live. They are also destinations.
Tourism isn't just an economic statistic here — for many of these islands, it's the coastline itself that's the product. Beaches, reefs, and shorelines are both the attraction and the thing most directly threatened by the trends in the previous sections.
Tourism can bring employment, income and international connections — making it an important part of the economic landscape.
But total arrivals can be misleading when comparing countries of very different sizes.
Insead we use:
Tourism per capita =
The contrast is striking!
This gives us another perspective of how large tourism is relative to the population that supports it.
Tuvalu has no tourism industry data in the official record at all —
not because tourism doesn't matter there, but because, unlike its
neighbours, tourism plays a comparatively small documented role. Its risk, as the next
sections show, comes from somewhere else entirely!
So far, we've looked at the signals separately:
Vanuatu ranks highest at 69.5. Tuvalu sits lowest at 36.9 — not because it faces no threat, but because its risk concentrates differently, as the next chart shows.
This is not a prediction. It's a snapshot of relative vulnerability today, built from the best available official data.
This is a comparative index developed for this analysis, not an official climate-risk ranking. The score reflects the selected indicators and weighting methodology.
A ranking tells us where the highest combined pressure appears. But a number alone cannot tell us why.
A single number can hide as much as it reveals. This chart breaks each island's score into what's actually driving it
The Climate Risk Index can be unpacked into three dimensions:
There is no single Pacific climate story.
The ocean is changing; Temperatures are shifting; Populations are evolving; Economies are connected to places far beyond the shoreline;
And the pressures do not fall evenly.
Climate risk is not just about how much the climate changes. It is about what that change meets.
The future of paradise may depend not only on what changes — but on how prepared we are to respond.
This index currently covers five islands and a fixed set of indicators. A natural next step would be extending it to the full set of Pacific nations, incorporating disaster-loss and displacement data as more complete records become available, and tracking how the index shifts year over year rather than as a single snapshot.
Data sources: Sea level anomalies, Rainfall
anomalies, Mean surface temperature anomalies, Population growth, Coastline and
tourist arrivals — official dataset list, Pacific Data Hub;
Population totals — World Bank Open
Data.
Climate Risk Index formula:
Climate Risk Index = 0.50 × Physical Exposure + 0.25 × Population
Exposure + 0.25 × Economic Exposure.
Physical Exposure is the average of five indicators: sea level trend,
coastline erosion rate, share of coastline actively eroding,
temperature anomaly magnitude, and rainfall anomaly magnitude — each
normalized by percentile rank across the five islands.
A note on Tuvalu: Tourism arrival data was
unavailable for Tuvalu in both the official Pacific Data Hub source
and a supplementary World Bank check. Rather than estimate a figure,
Tuvalu's index excludes the economic exposure component entirely and
reweights physical exposure to 81% and population exposure to 19%.
A note on coastline data: Coastline erosion is
measured using the median (not mean) shoreline movement rate per
island, since a small number of extreme outlier points were found to
distort the mean. Only measurements flagged "good" certainty by the
source dataset were used.
A note on tourism dependence: Tourism exposure is
measured as tourist arrivals per 100 residents, not raw arrival
counts, so that a country's overall economic size doesn't overstate
its relative dependence on tourism.
Limitations: This index reflects exposure based on currently available public data. It is not a forecast, and a lower score does not mean an island is safe — it means its risk, based on the indicators measured here, is comparatively lower than its neighbors'.
Built with Python, Plotly, and Canva for the Pacific Dataviz Challenge 2026.
Background images for Island introduction: T.M on Unsplash and Canva elements.